

The P/E Multiple
A Good Refresher or Helpful Guide

"The stock market is filled with individuals who know the price of everything, but the value of nothing."
— Philip Fisher
The P/E Multiple: A Good Refresher or Helpful Guide
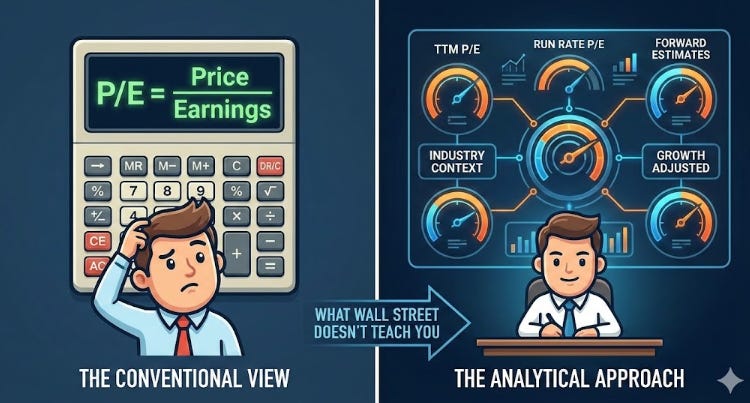
Most investors learn about the P/E ratio (“earnings multiple” or “multiple” or “P/E” for purposes of this discussion) in the first 5 minutes of their investing journey.
Price divided by earnings… seems simple enough!
But I’ve noticed over the years that most investors, usually the new’er’ retail investors, are still using it incorrectly years later… or at least looking at it from a narrow scope.
Today I want to fix that.
Let’s start from first principles, then discuss how to use the metric on a relative basis and dig into some one-off, use case strategies to make this metric more dynamic.
Feel free to skip around this post —> I know many of you are familiar with some of these concepts but maybe are newer to other concepts.
Let’s dive in.
Contents
1. What You’re Actually Looking At
2. The Forward P/E
3. Run-Rate Analysis
4. Growth Adjusting with PEG
6. Relative Expansion & Contraction
7. Comparing to Industry & Peers
8. When the Multiple Breaks Down
9. The Balancing Act of Putting it All Together
As always, I would really appreciate if you shared this post and subscribed to ThePrivatePublicInvestor, as I try my hardest each week to give you custom, in-depth analysis on stock investments, market insights and portfolio strategies.
With a subscription to the ThePrivatePublicInvestor, you will receive insight into my personal portfolio, along with each position I own and the related weighting, along with my personal watchlist, custom templates for valuation and modeling (coming soon), additional in-depth analysis on my portfolio holdings, decision-making investment guides, and the personal chat feature for the community.
As this channel grows, paid subscriptions will start to be incorporated, so subscribe early and stay subscribed to receive ‘founding member’ pricing and exclusive benefits.
With that, enjoy this piece and let me know if you have any questions!
What You’re Actually Looking At
When you pull up a stock on Yahoo Finance or Google and see a P/E ratio, you’re almost always looking at a trailing twelve months (TTM) figure.
That’s the current stock price divided by the last four quarters of reported earnings per share (EPS).
It’s backward-looking. And that’s fine as a starting point!
But the direction of the earnings multiple matters just as much as the ratio itself.
A stock trading at 30x earnings that was at 40x six months ago is telling you a different story than one at 30x that was at 20x.
Is the multiple compressing because earnings are growing into the valuation?
As in, the denominator is growing faster than the numerator
Is it expanding because the market is getting ahead of itself?
As in, stocks are trending to the upside, pushing up valuations
Tracking the trend helps tell the story of how the market has viewed the valuation of the business over time.
Pairing this ‘valuation over time’ with other aspects of your investment thesis such as your financial model (projections, KPIs, etc.) can help craft a more fulsome investment thesis.
So, remember to track the trend, not just the snapshot.
Forward P/E: The Market’s Expectations
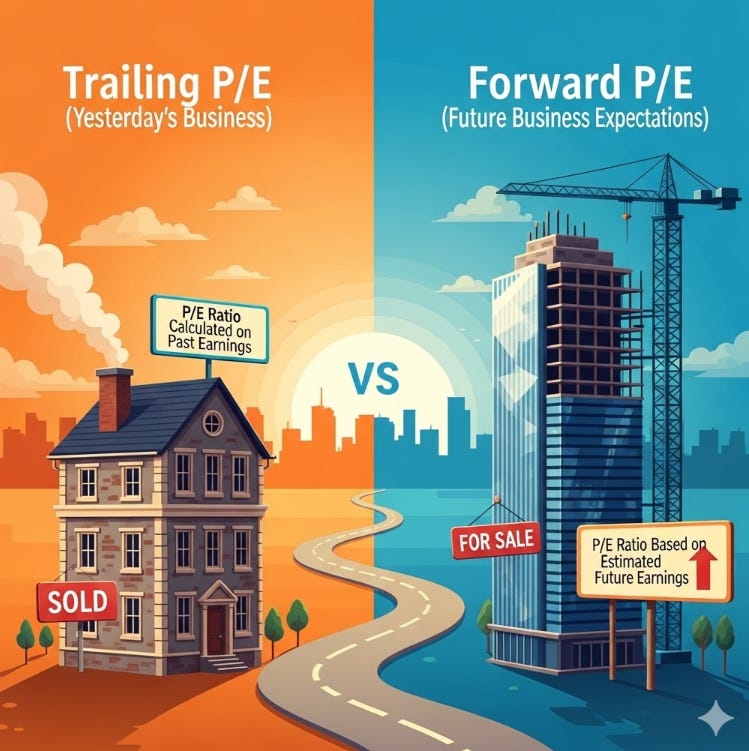
Stocks are priced based on future earnings, not historical earnings.
The trailing P/E tells you what the market paid for yesterday’s business while the forward P/E tells you what the market is paying for what this business is expected to look like in the future.
—> This is arguably the most important variation of the metric in my opinion.
The forward P/E uses analyst consensus estimates for the next twelve months of earnings as the denominator (aka Wall Street’s estimates), rather than the company’s reported, actual last twelve months of financial performance.
This is why it matters:
Imagine a company just went through a rough year. Maybe they had company or a complete product portfolio restructuring to meet market demand.
The trailing P/E might look absurdly high, say 60x, because the company just had a bunch of expenses to realize on their P&L.
But, if analysts expect earnings next year to double because they are betting on or “pricing in” a successful turnaround of the business, the forward P/E could be 25-30x.
Those are two completely different investment stories. Ignoring the forward P/E because the trailing number looks “expensive” could mean you miss a turnaround thesis playing out.
But it’s not just turnarounds, that was just an example. Let me give you a better example:
Let’s think of a high-growth tech firm that just finished some heavy R&D spending on a new product. Its trailing P/E might be 100x because past earnings were suppressed by all of that R&D spending.
However, if the business is rolling out or just launched that new product, next year’s earnings could quintuple.
Let’s say the forward P/E being priced in is 20x: the stock is actually cheap relative to its imminent scale.
—> Using only trailing data is like driving a car by only looking in the rearview mirror; it tells you where you’ve been, but the forward P/E shows you the turn ahead.
Here’s my challenge to you:
Don’t just look up the forward P/E. Build your own.
Even a simple model works. Take your projected revenue, apply the margin you think is realistic, back into EPS, and divide the current price by that number.
Now you have your own forward P/E.
Compare it to the Street’s consensus. If the Street says 25x forward and your model says 18x, try to understand that gap.
Are you more bullish on margins?
Are analysts underestimating a revenue headwind?
Are they being too conservative on a new product rollout?
Try this for practice even if it seems like a waste of time. Writing this down will help you conceptualize this concept.
This is the difference between reading someone else’s opinion and forming your own.
Run-Rate Analysis: An Alternative Lens
A strategy I’ve taken from my experience in the private markets and applied to valuing public companies is applying a run-rate to a company’s last fiscal quarter or quarters. This involves:
Taking the most recent quarter’s EPS, annualizing it (multiply by four), and using that as your denominator in the P/E ratio. This gives you the “last quarter run rate” P/E.
Why does this matter?
Because businesses change.
If a company just posted a breakout quarter, maybe margins expanded? Maybe a new revenue stream kicked in?
Personally, I like to use 2 quarters for businesses because it strips out possible single-quarter noise such as macroeconomic supply/demand changes or maybe something like raw material price volatility. Using the last two quarters smooths that out while still giving you something more current than the full TTM figure.
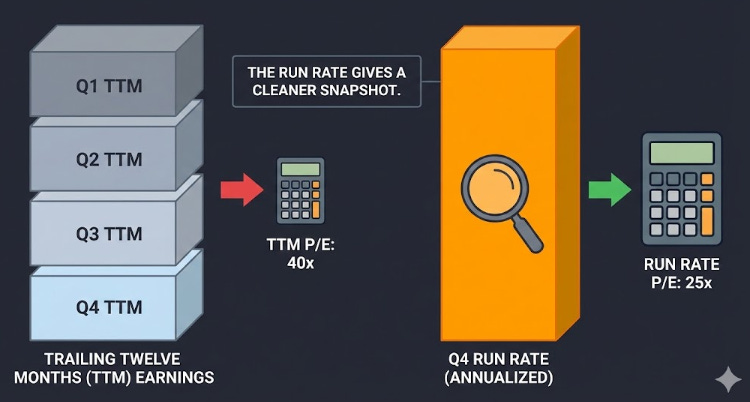
The TTM number is dragging along three older quarters that no longer reflect the current business.
The run rate P/E can give you a more insightful snapshot of what the business actually looks like right now.
Quick example: say a company earned $1.00 EPS over the TTM, but the most recent two quarters came in at $0.35 and $0.40. Annualizing those two quarters gives you $1.50 ($0.75 × 2).
On a $40 stock, the TTM P/E is 40x, but the run-rate P/E is ~27x. Very different valuation!
You can also get creative here by stripping out one-time charges, normalizing for seasonality if the business is cyclical or adjust for SBC if it’s distorting GAAP earnings.
The point here is to get closer to the true earnings power of the business.
Try this as well:
—> Compare your run-rate P/E to the forward P/E
If the run rate P/E is 27x and the consensus forward P/E is 22x, the market is expecting earnings acceleration.
Is that realistic?
What needs to happen for the business to get there?
Where is that margin expansion coming from?
Is there new technology in place that will help accelerate this?
Did they make recent hires in the previous year that will ramp during the next year(s)?
Ask these questions first.
If you think the margin acceleration is coming, you might have a compelling entry point.
If you think the Street is too optimistic, maybe wait it out. I’ve found this to be a useful quick-check in my analysis.
Note that run-rate analysis is only helpful for companies without dramatic seasonality. For example, this wouldn’t be super helpful for a company like Abercrombie if you are run-rating the last 2 quarters of the calendar year (inflated financials from the holiday season).
Run-rate analysis would be helpful for valuing a company like Adobe with more recurring-based revenue without seasonality.
Performing this run-rate analysis for metrics like ARR for tech businesses are a popular use case — but this run-rate analysis can be applied to multiples such as P/E as well.
One more practical note:
If a company is days away from their earnings report, be cautious about making valuation judgments based on the current P/E. That denominator is prone to change short-term, and as investors, we don’t want to hinge on short outcomes.
In case you missed it, here are some of the best investing insights for 2026:
Growth Adjusting Your P/E
Once you’re comfortable with forward P/E, the next step to rounding out our understanding of earnings multiples is asking:
“Is this P/E justified given how fast the company is growing?”
I personally use this ratio less than most people, but the PEG ratio, in theory, addresses this question on a relative basis.
PEG = P/E ratio ÷ expected earnings growth rate (expressed as a #, not a %)
So, broadly, a PEG below 1.0 suggests a stock may be undervalued relative to its growth, while above 1.0 signals the market may be paying a premium.
So, a stock trading at 30x earnings with 30% expected growth will have a PEG of 1.0
Let’s say you’re comparing two companies in the same industry providing a very similar product/service offering.
Company A trades at a 20x P/E with projected 10% growth for the next year (PEG of 2.0)
Company B trades at 35x with 40% growth (PEG of 0.88)
On a P/E basis, Company A looks cheaper
On a PEG basis, Company B is the better deal
Company B looks cheaper because you’re paying less per unit of growth
This ratio is ONLY useful for comparing businesses in the same sector though, as a PEG ratio for a utility business would be much different than a AI-enabled SaaS business.
It does have its drawbacks due to it’s:
Reliance on forecasts, which are not always accurate
Ignores capital structure (cash and debt levels)
Meaningless measure for smaller companies with little profitability
Ignores businesses with cyclicality such as in energy or materials
The PEG ratio should be used as an additional metric to round-out an analysis, not a standalone measure of growth relative to earnings power.
Relative Expansion & Contraction:
I’ll start by saying I use this methodology a lot, as it’s great for relative analysis.
A stock can grow earnings 15% a year for five years, but if the P/E compresses from 30x to 15x over that same period, due to investors becoming bearish on the stock or future of that industry (like SaaS businesses in the market right now) your return is roughly flat.
Also, a company with “okay” earnings growth can deliver huge returns if the market re-rates the business, which can expand the multiple (this would be the inverse of the above, as investors would become bullish on the company or industry).
An example of this is the “picks and shovels” of the AI infrastructure industry, such as businesses who provide cleaning services to fabs, or electrician businesses that service datacenters.
These businesses may not have had crazy historical growth, but the growth expectations are sky-high due to the future buildout needs of AI infrastructure.
Think about what actually drives multiple expansion:
Improving growth expectations
Business model transformation (transaction-based to subscription revenue, for example)
Market sentiment turning positive on a sector
Multiple contraction is the opposite:
Slowing growth
Deteriorating sentiment
Competitive threats
Commoditized products
Understanding what could expand or contract the multiple is just as important as analyzing the earnings themselves.
This is also when comparing a company’s current P/E to its own historical range becomes very useful!
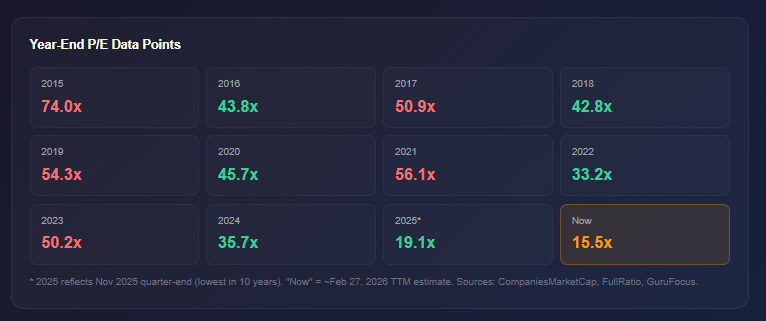
Let’s look at Adobe, as I think this company is undervalued currently, compared to where it’s traded historically on an earnings multiple.
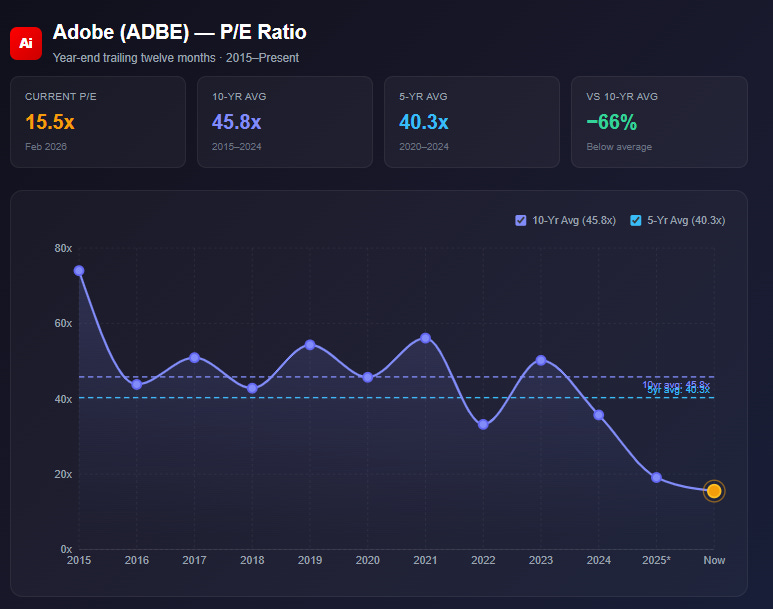
Adobe is trading at a ~15x multiple right now, when it’s traded at a ~45x average multiple over the last decade! Even if we take a more recent 5-year average, the multiple stands at 40x!
This is where it comes down to your own personal conviction.
Some folks believe this business’s service offering will become commoditized, which will re-rate the SaaS multiple down, which has driven the stock price meaningfully down over the past ~6 months, hence the “SaaS’pocalypse”.
I don’t think this is true, which would lead me to believe that this P/E is offering up a great deal!
—> This is where real risk/reward can become asymmetric
Your total return from a stock is a combination of earnings growth and the change in the multiple the market assigns to those earnings.
Comparing to the Industry
Stop comparing against the S&P 500’s overall P/E as your benchmark.
The spread between sectors is massive.
Energy stocks might trade at 7-8x earnings while tech trades at 30x+!
Comparing your Sandisk semiconductor play to P&G’s P/E is comparing apples to oranges. I hope you get this one, haha. Always compare within the sector, and ideally within the specific sub-vertical and provide similar services (sometimes you will have to broaden your comparisons, but you get my drift).
Even within the same industry, you need to ask why a company trades at a premium or discount to its peers. A company growing revenue at 25% deserves a higher multiple than another business growing topline at 5%.
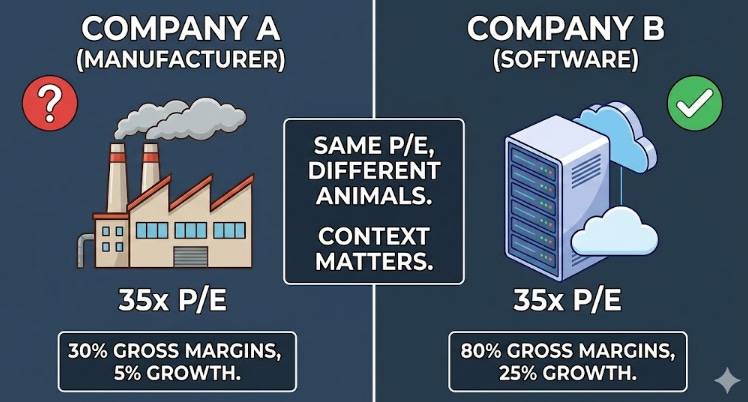
Margin profile matters as well. Same with capital intensity.
A software company trading at 35x with 80% gross margins is fundamentally different than a manufacturer at 35x with 30% margins.
Simply ask the question: is this premium or discount justified by the underlying business quality?
A stock trading at 2x its sector average P/E isn’t overvalued if it’s growing 3x as fast, and a stock trading at 20% of its sector average might be cheap for a reason (classic value trap)!
Dig into the why before making a judgment.
When P/E Breaks Down
Firstly, don’t use the P/E ratio when a company isn’t profitable or is barely profitable. It’s useless. A company earning $0.01 per share trading at $50 technically has a P/E of 5,000x. It doesn’t mean crap.
Think of Tesla back during their growth cycle in 2020 when their stock skyrocketed 700% —> they just became profitable that year and were valued at $750B+ by the end of the year!
For early-stage or high-growth companies that are reinvesting aggressively, you’re better off using a revenue multiple (EV/Rev) to get a sense of valuation relative to the scale of the business.
Even for profitable companies, watch for earnings that are inflated short-term by one-time expenses, heavy SBC or accounting changes.
P/E also doesn’t reflect capital structure!
Two companies can have the exact same P/E, but one might be loaded with debt generating those earnings while the other is debt-free.
Always ask : are these earnings real, recurring and representative? And what is the strength of the balance sheet?
The Balancing Act of Putting it All Together
It’s never just one metric. It’s the interplay between all of them.
When I look at a stock, I’m running through a mental back and forth:
What’s the TTM P/E?
How does that compare to the forward multiple?
What does the last two-quarter run rate tell me?
Is the market pricing in acceleration or deceleration of growth?
Is the PEG ratio telling me I’m paying a fair price for growth?
Where is the P/E relative to the historical range and sector peers?
What catalysts could drive multiple expansion?
What headwinds could compress the multiple?
When you layer these frameworks on top of each other, a picture emerges.
Maybe the run rate P/E is compressing, the forward P/E looks reasonable, the PEG is below 1, and the stock is near the bottom of its historical valuation range while the business is inflecting with tailwinds ahead.
—> That’s what a compelling setup looks like.
This balancing act is what real fundamental analysis looks like, and once you get good at it, you’ll be able to run that checklist above in 15min, especially with the power of AI these days.
It’s not about memorizing formulas.
It’s about developing the instinct to cross-reference multiple signals and form a novel view.

Takeaway This
The P/E ratio is a starting point.
Use the TTM to orient yourself, the forward P/E to understand what the market expects, the run-rate to gauge the business right now and the PEG to contextualize the growth.
Study the historical range for expansion and contraction signals and compare multiple with relevant peers.
Layer these frameworks.
Some of these ratios won’t work for certain businesses and you’ll have to use other analyses’ in your mental toolkit to evaluate the business. Just remember to think.
That’s the toolkit. Now go use it!
Disclaimer: The information provided in this publication is for informational and educational purposes only and does not constitute investment, financial, or other professional advice. ThePrivatePublicInvestor and its authors are not registered investment advisors or broker-dealers. All opinions expressed reflect personal views as of the date published and are subject to change without notice. While efforts are made to ensure accuracy, no guarantee of completeness or reliability is given. Past performance is not indicative of future results. The author may hold positions in securities discussed. Use of this content is at your own risk.